Function to create the Hilbert Plot
gghilbertplot(
  df,
  idcol,
  color = NULL,
  size = NULL,
  label = NULL,
  alpha = 1,
  add_curve = FALSE,
  curve_alpha = 1,
  curve_color = "black",
  jitter = 0
)
Arguments
| df | Data frame to generate plot from |
|---|---|
| idcol | The column name to be used for mapping (gghid) |
| color | The column to map to color |
| size | The column to map to size |
| label | The column that contains the label |
| alpha | The amount of alpha blending for the individual points |
| add_curve | Whether or not to add the underlying hilbert curve |
| curve_alpha | The amount of alpha blending for the hilbert curve |
| curve_color | The color of the hilbert curve |
| jitter | The amount of jitter to add to prevent overplotting |
Value
a ggplot object
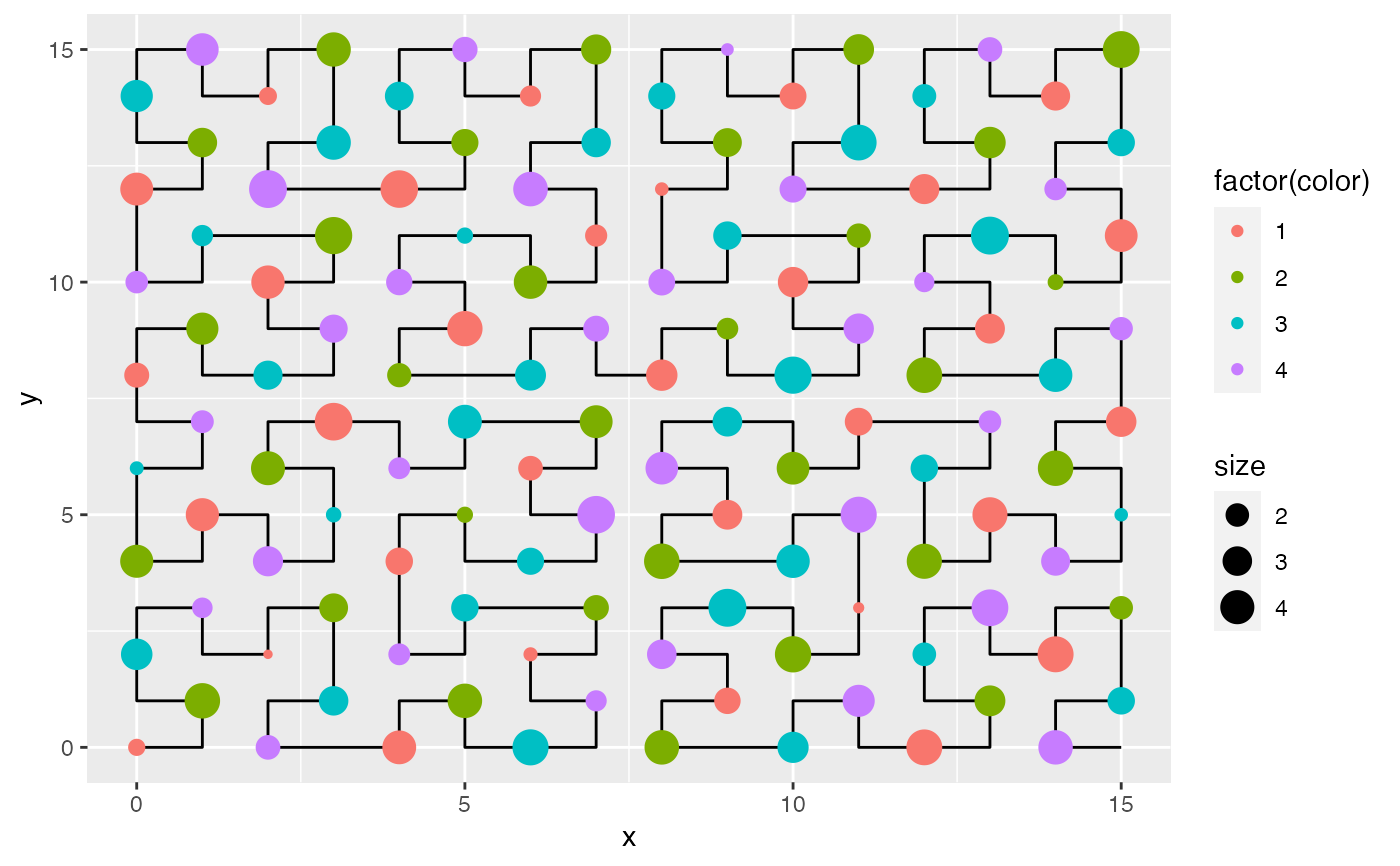
Examples
tibble::tibble(val = 1:128, size = runif(128, 1, 5), color = rep(c(1,2,3,4),32)) %>%
        gghilbertplot(val, color = factor(color), size = size, add_curve = TRUE)